

Saving Pennies to Make Dollars
When times are tough in the dairy industry, we try to find ways to become even more efficient than we already are, writes Laura Kieser, Extension Educator-Carver/Scott Counties. This report was published by the University of Minnesota Dairy Extension.We have to do more analyzing and monitoring of all aspects of the dairy operation. We still have to do the same amount of chores but have less time for them if we are devoting more time with business management. We have the same bills to pay with a smaller milk check. So, what can be done to make more dollars from the dairy at this time? One solution might be to look for those small items that can save pennies per animal, which can add up to saving you money in the long run. Here are a few places to start:
Reproduction
- Open vs Bred Cows – Open cows are more costly than bred cows. The cost for extra days open can vary from $3.19 to $5.41 per cow per year. This cost comes from breeding costs, replacement costs and reduced milk production (DeVries, U of FL, 2006).
- Pregnancy Rate – Producers are always being reminded to increase pregnancy. This will ensure that cows are coming back into the milking string on a more routine basis. But, what would the economic impact be to a herd that could increase their pregnancy rate? When a model was run to decrease days open from 166 days down to 112 days, profit per cow per year increased from $97 to $337 when pregnancy rate increased from 9% to 36% (DeVries).
Milk Yield
- Analyze which cows are helping to pay the bills and which ones are not. Using Dairy Comp or another type of herd analysis software, you can determine the average production of cows in your herd by age, stage of lactation or other parameters. How do individual cows compare to the herd average? Work with your DHIA supervisor, veterinarian or nutritionist to analyze your records and ask for their suggestions. They can also help you set up a list of benchmarks for your herd.
Milk Quality
- Mastitis – Treating mastitis cases are expensive, but what adds fuel to the fire with mastitis cases is the cost of lost milk production. One way to measure the effect of mastitis on milk yield is to look at linear scores. Table 1 illustrate an example of production losses for a 100-cow dairy with 50 first calf heifers and 50 older cows:
| Table 1. Calculation of production losses due to subclinical mastitis (Ruegg, WI). | ||||||
|---|---|---|---|---|---|---|
| Lact Group | # Cows | Linear Score | Goal | Est Milk Loss/unit LS | Milk lost per group (lbs) | Monthly production losses due to subclinical mastitis |
| 1 | 50 | 4.0 | -2.0 | X 200 lbs | 20,000 | |
| 2+ | 50 | 5.5 | -2.5 | X 400 lbs | 50,000 | |
| Milk price per lb: $0.10 X Total lbs lost: | 70,000 | ÷ 12 = $583 | ||||
If you want to calculate this information for your herd visit
http://www.uwex.edu/milkquality/Economics/index.htm.
- Somatic Cell Count (SCC) – High somatic cell counts are examples of lost opportunities. As you lower your SCC, your opportunity to earn quality premiums increase. In a study by Ruegg of herds in the National Dairy Herd Improvement Association, bulk tank SCC and production losses were compared between herds with low SCC (<200,000), herds with medium SCC (200,000 to 399.999) and herds with high SCC (>400,000). The overall production loss for the average U.S. dairy farm was estimated at $110/cow annually.
Retention value
- Maintaining cows is expensive, even when they are healthy. It will cost an average of $2.50/cwt to maintain a cow in the herd. This does not include her feed, facilities, care, etc. The cost to maintain the herd is the second or third greatest cost on many farms, after feed and labor (DeVries). Use the following to calculate the retention value on a cow (ranks cows for future profitability and culling decisions):
Future cash flow if keep the cow until optimum time of culling, then replace with a heifer (minus) Future cash flow if cull the cow today, then replace with a heifer.
If the retention value is determined to be greater than zero, then you should keep this cow. If the value is less than zero, then this cow should be replaced.
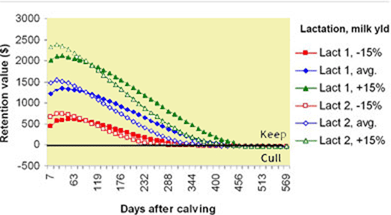
Graph 1. Relationship of retention value and cost per day open (click to enlarge)
Retention value(opencow)
What do you note in Graph 1? First, the costs per day open are going up (the retention value is decreasing) as the time after calving gets longer. Second, the costs per additional day open are higher for lower producing cows (Groenendaal and Galligan, U of Penn, 2005).
What influences the retention value of a cow?
- Month in lactation – cost per additional day open is higher as a cow progresses through her lactation
- Availability of replacement heifers
- Lactation number – cost per day open is higher for older animals
- Relative milk production – cost per day is lower for high producing animals
Reproduction, milk yield, milk quality and retention cost are just a few items that can be consistently analyzed and monitored to save pennies per animal, which can add up to more dollars to improve your bottom line during these difficult times.
July 2009


