

Marginal Decline in Dairy Input Costs Expected in 2012
The recovery in the dairy sector in 2010 has been reinforced by another year of relatively high milk prices in 2011, writes Trevor Donnellan from Teagasc's Agricultural Economics and Farm Surveys Department in his dairy outlook for 2011/12.Introduction
The recovery in the dairy sector in 2010 has been reinforced by another
year of relatively high milk prices in 2011. Global dairy commodity markets
remained buoyant in 2011 although there was some decline in prices
through the second half of the year. On the cost side, the direct costs of
production also increased, due to higher feed, fertiliser and energy
expenditure and this increase in the cost of production meant that the
increase in milk prices was not fully reflected in higher farm margins. In the
first half of 2011 milk production was up strongly on the corresponding
period in 2010 in response to high milk prices and good early season grass
growth. As 2011 progressed controlling milk production in order to avoid a
superlevy liability in 2012, became a serious issue on some farms.
As we enter 2012, international dairy prices have weakened in response to
an anticipated increase in the global availability of dairy products for exports
and the developing uncertainty about consumption growth in 2012, given
the current macro economic crisis. With only a marginal decline in input
costs expected in 2012, lower milk prices are likely to result in lower
margins from dairy production in 2012 in Ireland.
This paper looks back on dairy farm performance in 2010, reviews the
outcome for 2011 and looks ahead to the prospects for 2012. Data from
the Irish National Farm Survey (NFS) are used in our review of 2010. The
milk price and key input cost estimates for 2011 are used to produce an
overall estimate of dairy farm profit for 2011. Finally, in the concluding
sections of the paper, the forecast for milk price, production costs and dairy
farm margins in 2012 is presented.
Unless stated otherwise, all figures referred to in this paper are in nominal
terms and all income and profit estimates exclude the value of decoupled
income support payments.
Review of the Economic Performance of Dairy Farms in 2010
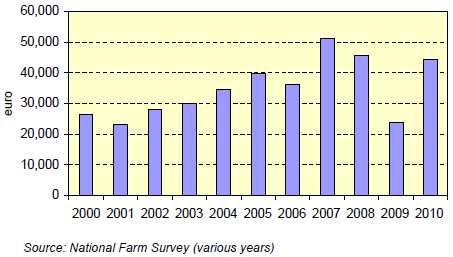
To examine the economic performance of dairy farms in 2010, we first look at how dairy farm income has changed over the last few years. Figure 1 presents the Family Farm Income (FFI) on Specialist Dairy farms in the period 2000 to 2010. A general upward trend in income can be observed, as can the increasing volatility of that income in the latter part of the decade. In 2010 the average family farm income increased to €44,000, which represented a substantial recovery from the low level of income recorded in 2010. The increase in income in 2010 came about as a result of an increase in both milk price and in milk delivery volume in 2010 relative to 2009.
Figure 1: Average Income on Irish Specialist Dairy Farms 2000 to 2010
To further explore the economic performance of dairy farms in 2010, we
next look at how margins have changed over the last few years. Table 1
presents the average gross output, gross margin and net margin per litre of
milk produced in 2009 and 2010.1
1 Farms producing mainly liquid milk are excluded from the sample as are herds of
10 cows or less.
The gross output measure includes the value of milk and calf sales minus
replacement costs. The value of milk sales typically accounts for more than
95 per cent of the gross output of dairy enterprises. As can be seen, gross
output per litre was up by over 31 per cent in 2010 relative to 2009. Total
direct costs were down by almost 5 per cent in 2010 compared to 2009 and
as a result the average gross margin was up almost 75 per cent on a cent
per litre basis relative to 2009. In 2010, total fixed costs increased by 15
per cent relative to 2009. The average net margin was 7.5 cent per litre in
2010, representing an almost 700 per cent increase on the extremely low
2009 level.
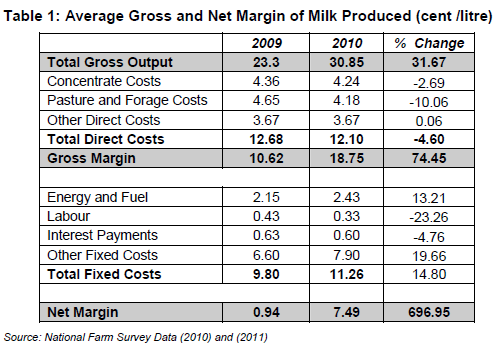
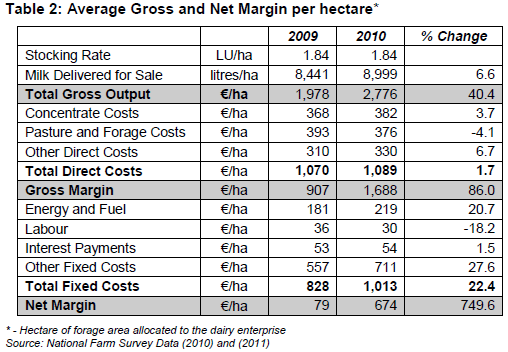
Table 2 presents gross output, gross margin and net margin per hectare of forage area allocated to the dairy enterprise.
The trend in margin per hectare is a little different to that presented in Table
1. Notably, there was a 7 per cent increase in milk deliveries per hectare in
2010 relative to 2009. As there was no change in the average stocking rate
from 2009 to 2010, the production increase was entirely due to a recovery
in deliveries per cow. The combination of considerably higher gross output
per litre and an increase in milk production per hectare, generated an
increase in gross output per hectare of 40 per cent in 2010 relative to 2009.
The average net margin per hectare in 2010 was €674, a 750 per cent
increase from the extremely low 2009 level.
In 2010 the national average cost of production was approximately 23.36
cent per litre (cpl). It is possible to divide the dairy farm sample to look at
cost groupings so that costs of production can be measured by cost
grouping. This is done for the best performing one third of farms (low cost),
the middle one third (moderate cost) and the poorest performing (high cost)
one third of dairy farms. The variation in costs across farms is apparent
from Figure 2.
Figure 2: Variation in Total Costs of Milk Production in Ireland in 2010
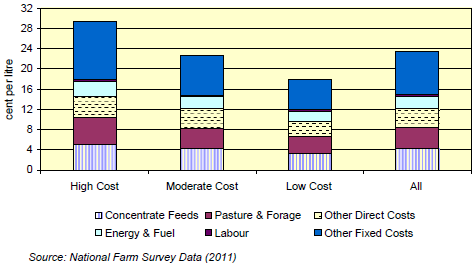
The average total cost of production on high cost farms in 2010 was 29.5
cpl, compared to 22.7 cpl on moderate cost farms and just 18.0 cpl on low
cost farms. Across the range of producers the difference in costs, between
the average of the best performing one-third of producers and the average
of the poorest performing farm group, was over 11 cpl in 2010.
Purchased concentrate feeds and pasture and forage costs represented
about 35 to 40 per cent of the total costs of production on dairy farms and
concentrate feed use is the most variable item across dairy farms.
Purchased concentrate feed costs varied from 3.3 cpl on low cost farms in
2010 to 5.1 cpl on high cost farms. Other direct costs ranged from 3.1 cpl to
4.1 cpl from low to high cost farms.
Fixed costs are broken into three categories; energy and fuel (including car,
electricity, phone and all fuel used on the farm), labour (including casual
and permanent hired labour) and all other fixed cost (including depreciation
and maintenance of machinery, buildings and land). The variation in these
costs across farms is broadly in line with the variation in direct costs.
Figure 3 presents gross output and net margin for the three farm cost
groupings. As is evident from Figure 3, the variation in gross output is
negligible, which indicates that the variation on cost is responsible for the
difference in net margin across the groupings.
Figure 3: Variation in Net Margin of Milk Production in Ireland in 2010
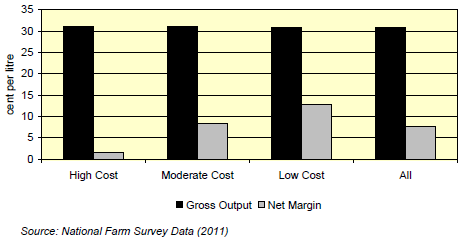
The average net margin on low cost farms in 2010 was 12.9 cpl compared
to the middle group of farmers at 8.3 cpl and the poorest performing farms
at an average of 1.6 cpl. This means that the difference in profit between
the low and high cost groups for a typical 250,000 litre farm was over
€28,000 in 2010.
Following a decrease in 2009, the total costs of dairy production rose once
more in 2010 but did not quite reach the record level of 2008. The increase
in total dairy costs in 2010 was a combination of slightly lower direct costs
and higher overall fixed costs.
Figure 4: Variation in Total Costs of Milk Production in Ireland in 2000 to 2010
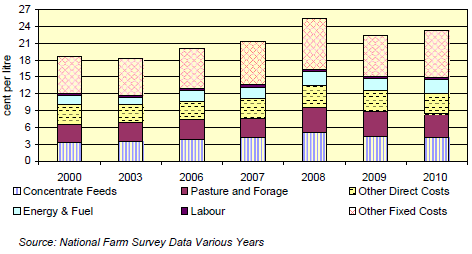
Figure 5 presents data on recent variations in profitability on dairy farms from 2007 to 2010. As is evident, margins in 2010 were up considerably on the 2009 level across all cost groupings.
Figure 5: Variation in Net Margin of Milk Production in Ireland from 2007 to 2010
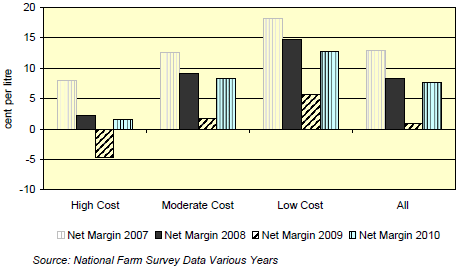
In summary, 2010 marked a notable recovery in dairy farm margins, based for the most part on a strong recovery in farm milk prices and in the volume of milk deliveries per ha in 2010 compared with the preceding year.
Review of 2011 Estimated Performance
This section of the paper presents a review of dairying in 2011. Since NFS results for 2011 will not be available until mid 2012, it is necessary to estimate the price and volume of inputs used in 2011, as well as the volume and price of outputs in 2011 in order to asses the outcome for margins. The following section of the paper first discusses costs in 2011, looking at both input prices and input usage volumes. Finally in this section, the development of dairy product markets in 2011 and the impact on milk prices is discussed.
Estimated Input Usage and Price 2011
Feedstuff – usage and price 2011
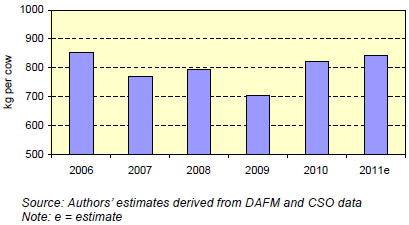
Purchased feed (concentrates) typically accounts for about 20 per cent of total input expenditure on dairy farms, although this varies by farm and by year. Figure 6 shows the average volume of compound feed use per cow. This is derived from Department of Agriculture, Food and the Marine (DAFM) figures on feed sales and from Central Statistics Office (CSO) data on animal numbers. The data indicate that aggregate dairy feed purchases were about 10 per cent ahead of the 2010 level in the first half of 2011 due to high levels of milk production.
Figure 6: Compound Feed Purchases per Dairy Cow in Ireland: National Average for 2006 to 2011
Monthly milk production in the first half of 2011 ran well ahead of normal
and by June 2011 it was clear that measures would be required at farm
level to avert a superlevy bill. As a result, monthly milk deliveries in the
second half of 2011 fell considerably below normal and feed use in the
second half of 2011 was curtailed considerably. Based on these data it would seem that the quantity of purchased compound dairy feed in 2011 is
about 3 per cent higher than the 2010 level.
Internationally, cereal prices rose rapidly in the second half of 2010 due to
the reduced volume of cereals traded internationally and this price rise then
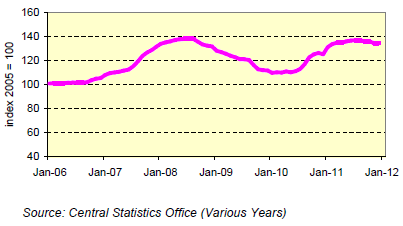
began to be transmitted through to the feed market in 2011. Figure 7 shows
an index of Irish cattle feed prices from 2006 to 2011. Based on the limited
official data available for 2011, the annual average feed price for 2011 is
estimated to have risen to about €290 per tonne, corresponding to a 17
per cent price increase on the average 2010 level. The 17 per cent increase
in feed prices in 2011, combined with the 3 per cent increase in dairy feed
volume, suggest that total expenditure on dairy feed in 2011 increased by
21 per cent on the 2010 level.
Figure 7: Monthly Price Index of Cattle Meal in Ireland 2006 to 2011
Fertiliser – usage and price 2011
Pasture and forage costs typically comprise about 20 per cent of total
production costs on dairy farms. Fertiliser purchases comprise about half of
this figure, with contractor costs accounting for most of the remainder.
The relatively stable nitrogen prices for much of 2010 were followed in 2011
by the return of fertiliser price inflation. Figure 8 charts the monthly index of
farm level fertiliser prices from 2006 through to 2011 in Ireland.
Figure 8: Monthly Price Index of Fertiliser in Ireland for 2006 to 2011
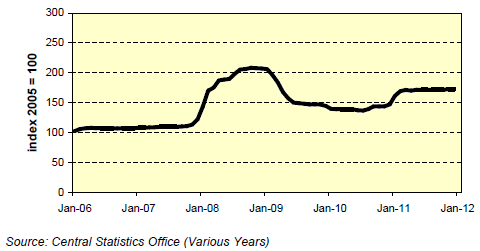
Dairy farmers generally will have experienced higher fertiliser prices in 2011 than in 2010. It is estimated that the fertiliser prices paid by dairy farmers in the first half of 2011 were up 25 per cent relative to the corresponding period in 2010. On the volume side, DAFM figures indicate that fertiliser sales in the 2011 fertiliser year (October 2010/September 2011) have decreased slightly on the preceding year for all three elements, with the largest decreases recorded for N (down 5 per cent) while P and K sales fell by 2 per cent and 3 per cent respectively. These fertiliser sales data are reported in Figure 9.
Figure 9: Irish Fertiliser Sales by Compounders 2000 to 2011
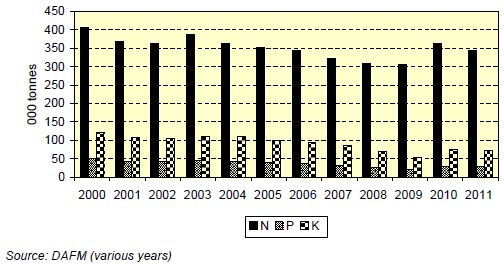
It is estimated that fertiliser use on dairy farms decreased by about 5 per cent in volume terms in 2011 relative to 2010. A more precise figure will be obtained from the forthcoming NFS results for 2011. In the case of nitrogen the figures for 2011 would suggest that the elevated sales level of 2010 was not an aberration and that the low level of nitrogen usage in 2008 and 2009 may have been induced by the high fertiliser prices in that period. Overall, taking account of the increase in fertiliser price and decrease in volume, this suggests that there has been an increase of about 19 per cent in fertiliser expenditure on dairy farms in 2011 compared with the 2010 level.
Contractor Costs usage and price 2011
Fertiliser costs comprise about 50 per cent of total pasture and forage costs, with the remaining half made up of contractor costs. While no official figures are available, there is reason to believe that there may have been some upward movement in contracting costs in 2011, reflecting the increase in fuel prices in 2011. On this basis, it is estimated that silage making costs increased by 5 per cent in 2011.
Pasture and Forage – usage and price 2011
With fertiliser expenditure up 19 per cent relative to 2010, and contracting costs increasing by 5 per cent, the overall estimated increase in pasture and forage costs for 2011 is just over 12 per cent.
Energy and Fuel – usage and price 2011
Energy and fuel are less important inputs in dairy production, comprising
just 8 per cent of total costs on dairy farms. Electricity typically comprises
about 30 per cent of the total expenditure on energy and fuel on dairy farms,
with motor fuel accounting for the remaining 70 per cent.
Motor Fuel: Crude oil prices are presented in Figure 10. Political
uncertainty in some oil exporting countries pushed crude oil prices upwards
in 2011. Brent crude oil prices rose from a monthly average of $92 per
barrel (pb) in Jan 2011 to reach a monthly average of close to $110 pb in
December 2011. The average price for Brent crude in 2011 was $108 pb.
Figure 10: Monthly Average Brent Crude oil prices in Euro and US dollar from 2000 to 2011
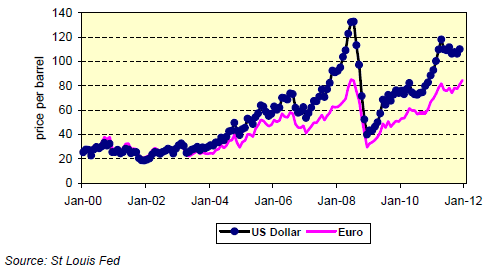
While the euro weakened versus the US dollar in the second half of 2011,
on an annual average basis it actually appreciated versus the US dollar by
about 4 per cent relative to its 2010 value. The strengthening of the euro
versus the US dollar in 2011 means that the extent of the per centage and
absolute crude oil price increase relative to 2010 was smaller when
expressed in euro terms than in dollar terms. The average crude oil price
for 2011 was just over €77 pb ($108), an increase in euro terms of 32
per cent on the 2010 value of about €58 pb ($77). This means that in
nominal euro terms, crude oil prices are now at their highest ever annual
level. Overall, fuel costs in Ireland increased significantly in 2011, with
diesel prices approximately 18 per cent higher in 2011 relative to the 2010
level.
Electricity: Electricity costs change infrequently in Ireland due to price
regulation. The most recent price change was an increase in October 2011.
On an annual average basis this means that prices have risen by about 5
per cent in 2011, relative to 2010.
Energy and Fuel: Demand by farmers for fuel and electricity tends to be
relatively inelastic with respect to price. Therefore, it is assumed that usage
in 2011 will be on a par with the 2010 level. The overall expenditure on
electricity in 2011 is anticipated to have increased by 5 per cent on the 2010
level, while expenditure on fuel in 2011 is likely to have increased by 17
per cent on the 2010 level. Overall, expenditure on energy and fuel on dairy
farms is estimated to have risen by 14 per cent in 2011 relative to 2010.
All Other Direct and Fixed Costs– usage and price 2011
Agricultural wages in Ireland are estimated to have increased very slightly in 2011. Again, it is assumed that the quantity of labour used on farms is likely to have changed little year on year. With the volume of labour assumed to be unchanged, labour costs are estimated to be up 1 per cent in 2011 on the 2010 level. Reflecting the limited price inflation in the general economy, it is estimated that the price of other input items were up 1 per cent in 2011. It is assumed that usage of these input items will be unchanged and, as a result, the increase in prices is reflected in a corresponding increase in expenditure on these items. All other fixed costs in 2011 are estimated to have been largely unchanged.
Estimate of Total Input expenditure for 2011
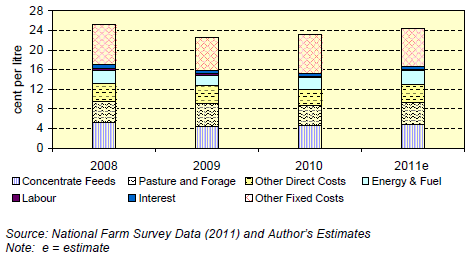
An important consideration in the cost story in 2011 is that the volume of milk production rose by 3 per cent nationally on a fat adjusted basis relative to 2010, and some of the increase in costs in 2011 is attributable to increased input usage needed to produce this additional output. The preceding discussion of costs reflected changes estimated on a per hectare basis. When the increase in milk output is taken into consideration and costs are expressed on a per litre basis, the cost story for 2011 is a little more benign. Figure 11 charts the average total costs of production for the years 2008 to 2010 and the estimates for 2011. It is estimated that the total costs of production in Ireland in 2011 was 24.31 cent per litre. This is equivalent to a 4 per cent increase in 2011 relative to 2010.
Figure 11: Total Costs of Milk Production in Ireland in 2008, 2009 and 2010 and estimates for 2011
Estimated Output Values 2011
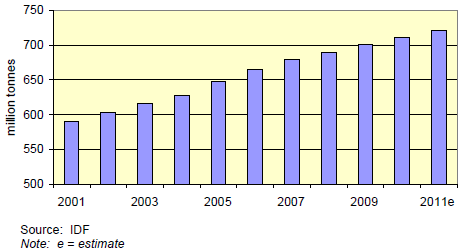
Global milk production figures are shown in Figure 12. Production increased to 723 million tonnes (mt) in 2011 up from 711mt in 2010.
Figure 12: Global Milk Production
However, the extent of the increase in global import demand meant that
higher international prices were required to balance supply and demand.
On an annual average basis international dairy product prices rose in 2012
relative to 2011, most notably for butter where prices were at a record level
in the EU. In spite of a 2 per cent increase in milk production in the EU,
continuing strong consumption at the global level required that dairy
commodity prices remained high.
As illustrated in Figure 13 monthly Irish milk deliveries in 2011 were
characterised by a surge in the first half of 2011 relative to 2012, followed
by a contraction in the second half of the year as measures were taken at
farm level to prevent a super levy at the end of the 2011/12 milk quota year.
Overall, milk production in the 2011 calendar year was up 3 per cent on the
2010 level.
In 2011 CSO moved to a new methodology for its cattle enumeration and
this has led to revisions to the data for some recent years. Irish dairy cow
numbers have remained relatively stable at about 1.028 million head. Good
weather conditions and additional feed supplementation in the first half of
2011, in light of the high milk price, resulted in an overall increase in milk
yields per cow in 2011, but some of the additional milk produced will have
been diverted to calf feeding due to milk quota constraints. There is also anecdotal evidence of earlier drying off and a switch to once a day milking
on farms which would otherwise have faced superlevy bills in 2012.
Figure 13: Irish Milk Deliveries 2010 and 2011
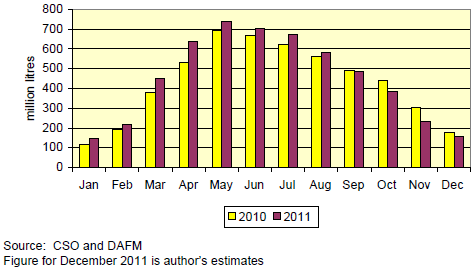
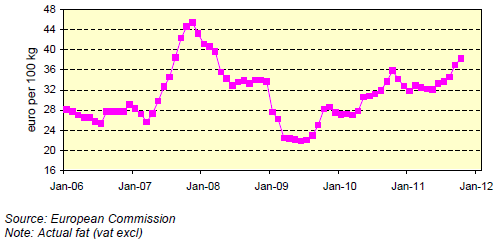
Figure 14 presents monthly Irish milk prices recorded by the European Commission from 2006 through to October 2011. In Ireland the 2011 manufacturing milk price continued to increase relative to the 2010 level. Monthly milk prices reached 33 cent per litre early in 2011 and were sustained at that level through the peak milk production period. Price rose further in the latter months of 2011 aided by high milk fat content.
Figure 14: Irish Farm Gate Milk Prices (vat excl) 2006 - 2011
The average milk price for 2011 is estimated to be about 34 cent per litre vat inclusive. This is an increase of 4 cent per litre, or approximately 13 per cent, on the 2010 level. The positive impact of the higher 2011 milk price on Irish milk deliveries in 2011 can be observed in Figure 15.
Figure 15: Irish Milk Deliveries (fat adjusted) and Quota Surplus/Deficit (calendar and quota year basis)
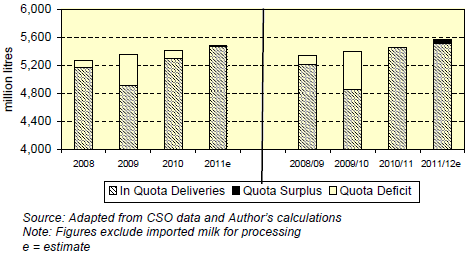
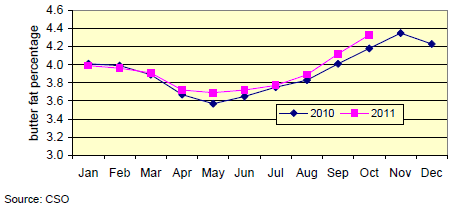
On a calendar year basis Irish milk deliveries in 2011 will be 3 per cent above the 2010 level. The trend in milk deliveries is suggestive of a superley at the end of the 2011/12 milk quota year based on a forecast quota surplus of about 1 per cent. Elevated butterfat levels in 2011, as illustrated in Figure 16, are contributing to the size of the required butterfat adjustment. The average fat content of Irish milk deliveries in 2011 is likely to exceed 4 per cent, inflating the adjusted milk deliveries figure still further.
Figure 16: Butterfat in Irish Milk Deliveries 2010-2011
Review of Dairy Enterprise Net Margins in 2011
The review of milk prices showed that the average milk price for 2011 was up 13 per cent on the average for 2010, while the review of input costs concluded that total production costs on a per litre basis are estimated to have increased by 4 per cent in 2011 relative to 2010. Figure 17 presents the estimated average gross output, production costs and net margin per litre for 2011 in comparison to 2010.
Figure 17: Gross Output, Costs and Margins per litre for milk production in Ireland in 2009, 2010 and estimates for 2011
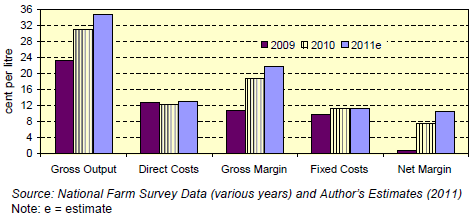
Gross output per litre is estimated to have increased in 2011 to 34.7 cpl. Input costs also increased but not to the same extent as output giving rise to an improvement in margins in 2011. It is estimated that the average net margin per litre increased from less that 7.5 cpl in 2010 to 10.4 cpl in 2011. Estimated average net margin per hectare is shown in Figure 18.
Figure 18: Gross Output, Costs and Margins per Hectare for Milk Production in Ireland in 2009, 2010 and estimate for 2011
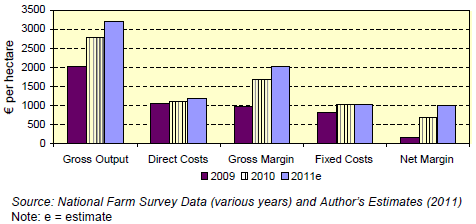
Net margin per hectare increased from 2010 to 2011, rising from an average of €674 per hectare in 2010 to an estimated € 991 per hectare in 2011. It is estimated that gross output per hectare increased by 16 per cent from 2010 to 2011. This is slightly more than the increase recorded on a per litre basis as there was also an estimated increase in the delivery volume per hectare. Net margin per hectare is estimated to have increased by 47 per cent in 2011 relative to 2010.
Outlook for 2012
In this section we forecast the expenditure on various input items in 2012, the annual average milk price that will prevail and the likely profit margins in dairying in 2012.
The Outlook for Input Expenditure
Feedstuffs – usage and price 2012
The 2011 Irish harvest prices for feed wheat and barley increased relative
to the 2010 figure due to the continuing shortage of grain on international
markets. Prices for cereals in 2011 were up about 15 per cent on the 2010
level.
Farmers purchasing feed in the first half of 2012 can expect to pay slightly
more than they did in the corresponding period in 2011. However, it is
anticipated that feed prices will fall as 2012 progresses due to the
anticipated lower 2012 grain harvest prices. In Ireland the forecast is for a
decline in cereal prices in 2012 of about 12 per cent compared to the 2011
level.
It is anticipated that milk production will decrease by 3 per cent in 2012
relative to 2011. This decrease would reflect the need for a depressed level
of milk production early in 2012 (relative to early 2011) so as to avoid a
superlevy. Dairy product and milk prices are expected to decline due to
better availability of product for export globally, as will feed prices in
response to a general downturn in international grain prices. It is assumed
therefore that the level of concentrate use in 2012 will be more or less
unchanged on the 2011 level.
Overall, a decrease in feed prices of 8 per cent is forecast for dairy farms in
2011. An 8 per cent decrease in feed price, coupled with no change in feed
volume would leave feed expenditure in 2011 8 per cent down on the 2011
level.
Fertiliser & Contracting Costs– usage and price 2012
Elevated energy prices and global competition for relatively fixed fertiliser
supplies, provide a basis for higher fertiliser prices in the early part of 2012
than were experienced in 2011.
Higher Urea and CAN prices are expected in 2012 compared with 2011.
Price increases could be of the order of 7 per cent in 2012 relative to the
average 2011 level. As a result, the prices paid for fertiliser by Irish dairy
farmers in the first half of 2012 will be higher than the 2011 average level. It
is reasonable to expect that fertiliser usage levels in 2012 will be on a par
with 2011.
With prices up 7 per cent and usage levels unchanged, this would leave
total expenditure on fertiliser up 7 per cent in 2012. Given that fuel prices
are expected to be unchanged in 2012, no increase in agricultural
contracting costs is forecast. Overall this would mean that total expenditure
on pasture and forage would be up 4 per cent in 2012 compared to the 2011
level.
Energy and Fuel – usage and price 2012
Increases in crude oil and natural gas prices took place in 2011 and market
experts consider that oil exporting countries will adjust supply to try to
maintain crude oil prices close to US $100 in 2012.
As of December 2011, the average Brent crude oil futures price for 2012 is
about $100 pb. This equates to about €76 pb at December 2011 exchange
rates which would represent a decrease of about 1 per cent on the 2011
level. Specific Irish inflationary pressures also exist through the rising
carbon levy and VAT on fuel. A weakening of the euro versus the US dollar
is also possible, but overall we do not see an increase in the annual
average price of farm diesel in 2012 relative to the average for 2011.
Electricity prices increased late in 2011 and barring a further change in
energy price in the first half of 2012, electricity prices will still be up on the
average level for 2011 by about 5 per cent in 2012. This would leave overall
expenditure on energy and fuel up about 2 per cent in 2012 relative to the
2011 level.
Other Direct and Fixed Costs – usage and price 2012
Given the continuing Irish economic difficulties and high level of unemployment, the increase in labour costs and general inflation in 2012 are forecast to be no more than 1 per cent. No change in fixed costs is anticipated in 2012.
The Outlook for Dairy Markets in 2012
As of December 2011 international dairy prices are continuing to move
downward, as they have since the middle of 2011. In regions where grain
feeding predominates there may be some reduction in cost pressures on
the back of lower feed prices.
In the EU some further expansion in milk production in Member States
where the quota is not binding could emerge in 2012. EU milk production in
2011 is up 2 per cent on the 2010 level. Early season 2011/12 New
Zealand milk production is up on the previous season leading to forecasts
of increased New Zealand dairy exports in 2012 of about 1.5 per cent. US
production is likely to increase by at least 1 per cent.
In contrast to 2010 and 2011 lrish milk prices are likely to move downward,
but it must be emphasised that any such reduction would be from the very
high 2011 level. Overall, it is estimated that annual average milk price in
2012 could be just over 31 cents per litre.
A recession in the EU in 2012 seems likely and if the current economic
situation were to bring about a return to a wider global recession in 2012
then a more pronounced decrease in Irish milk prices could emerge. Dairy
products are one of a number of livestock products whose price is more
sensitive to adverse income shocks in developing countries.
The Outlook for Dairy Enterprise Net Margins in 2012
In aggregate, input expenditure is expected to decrease in 2012, by
approximately 2 per cent per hectare, and together with a reduction in milk
prices, net margins in 2012 are forecast to contract relative to the 2011
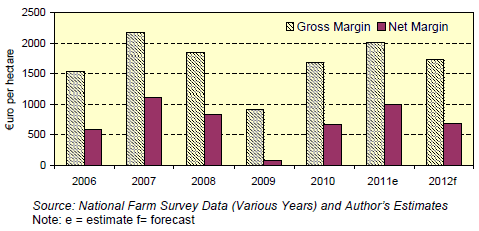
level. Figure 19 presents margins on a per hectare basis.
Based on the forecast 7 per cent reduction in Irish milk prices to just over 31
cents per litre in 2012 and allowing for some reduction in production in
calendar year 2012 of about 2 per cent to avoid a reoccurrence of superlevy
management problems, average gross margins per hectare are forecast to
be €1,734 per hectare in 2012 and net margin is forecast to be €683 per
hectare.
Figure 19: Gross and Net Margin for Milk Production per Hectare with Forecast for 2012
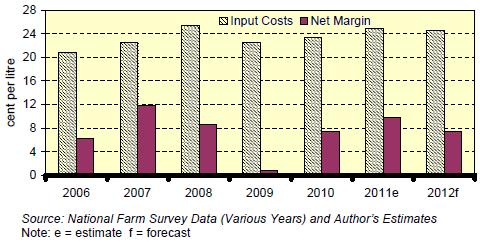
In Figure 20 the forecast for average net margins per litre in 2012 is presented. Due to the projected decrease in milk deliveries relative to 2011, margins per litre are forecast to decline by slightly less than margins per hectare. Under this forecast the average net margin for 2012 is estimated to be 7.5 cpl. This would represent a decline of 28 per cent on the estimated 2011 average net margin figure, but this forecast margin for 2012 would not be very different from the net margin per litre achieved in 2010.
Figure 20: Net Margin per Litre for Milk Production in Ireland 2006 to 2010 with Estimate for 2011 and Forecast for 2012
Concluding Comments
Following a recovery in 2010, dairy margins improved further in 2011,
mainly due to higher milk prices. The dairy sector in Ireland continued to
benefit particularly from high world dairy product prices but some producers
have also run into difficulties with quota management.
Forecast supply and demand conditions suggest that dairy market prices
will remain high in 2012 although not as high as in 2011. A slight decline in
overall production costs per hectare in 2012 relative to 2011 is forecast.
Based on these forecast output price and input cost movements, dairy
margins are likely to decline in 2012 compared with 2011. Nevertheless,
forecast dairy margins in 2012 should be close to 2010 levels. Given that
there is no prospect of a shortfall in Irish milk production relative to milk
quota, producers will need to remain vigilant in 2012 in order to avoid the
pressures created in 2011 by excess early season milk production.
Further Reading
| - | You can view the full report by clicking here. |
January 2012

