

July Cattle Report: Beef Cattle Numbers Down
By Shane Ellis, Iowa Farm Outlook. Iowa State University Extension. The July cattle report indicated that most classifications of cattle are down or steady from a year ago. Total cattle numbers are down 0.4 percent from a year ago at 104.8 million head. Beef cow numbers were also down 0.3 percent at 33.4 million head.
Dairy cow inventories remain even with a year ago at 9.2 million head. Dairy heifer retention is up 2.6 percent due to the continued profitability of high milk prices. Beef heifer retention on the other hand is down 6 percent. Feeder cattle supplies are up 0.3 percent from a year ago, due mostly to an increased number of feeder heifers. Table 1 contains a summary of the July cattle report.
| Million Hd. | % chg. | |
|---|---|---|
| All cattle | 104.8 | -0.4% |
| Cow | 42.5 | -0.2% |
| Beef | 33.4 | -0.3% |
| Milk | 9.2 | 0.0% |
| Heifers | 16.6 | 0.0% |
| Beef replacements | 4.7 | -6.0% |
| Milk replacements | 3.9 | 2.6% |
| Feeder heifers | 8.0 | 2.6% |
| Steers | 14.9 | -0.7% |
| Bulls | 2.1 | 0.0% |
| Calves | 28.7 | -0.7% |
| Calf crop | 37.4 | -0.4% |
| Cattle on feed | 12.3 | -1.6% |
Generally, beef cow numbers are the indicator of where the national herd is going, and beef heifer retention is its precursor. Domestic feeder animal supplies are currently up this year, but there will be fewer beef calves produced for at least the next two years. Although additional dairy calves may be produced in the future, continued expansion in the dairy herd will siphon off some of the additional dairy feeder cattle. The price of corn and other feed sources will remain the dominant influence on calf prices in the fourth quarter, further suppressing the role that feeder cattle availability has in the market.
What has happened to the “ten year” cattle cycle?
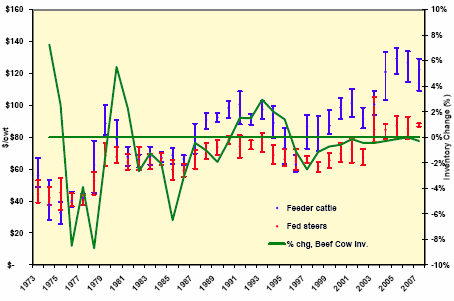
The US cattle industry does experience up and down trends in cattle inventories. Usually the inventories peak, decline and then rebound to another peak about every decade. According to past July cattle reports the troughs in this cycle have occurred in 1979-80, 1990-91, and 2000-01. History has also indicated that cattle prices have a strong influence on the growth and decline of cattle inventories. Have feeder cattle prices declined enough to warrant the recent increase in cow slaughter and decrease beef cow numbers? Beef cow slaughter so far this year is up 12 percent from last year and 25 percent from two years ago. Figure 1 contains a graph that illustrates the interaction between beef price of fed and feeder cattle and the percentage change in mid year cattle inventories. The trend between feeder cattle prices and beef cow inventory change is very evident until eight years ago. Even though cattle prices were increasing, July cow inventories continued to decline, only at a slower rate. In the past three years the price of feeder cattle and fed cattle have set new record highs and yet the beef herd expansion remained in the doldrums.

Figure 1 also contains the high and low range in which cattle prices occurred during the year. Although there is no significant correlation between annual price variance and change in beef cow numbers, it does appear that a combination of price change and the margin of price variation is a precursor to direction and speed of change in inventory expansion and decline. Exceptions to this seem to happen in years of widespread drought and low forage availability. Feeder cattle prices in the past four years have been very profitable for cow-calf producers, so why isn’t there more expansion? Historical comparison indicates that market uncertainty still impacts producer decisions. The last time mid-year beef cow numbers actually increased from the previous year was in 1996, and last year was the first time since 1997 that beef cow inventories stopped declining and leveled off. Feeder cattle prices have declined in the past two years with considerable price variability and beef cow numbers have again started to decline. Perhaps the “building stage” of the cattle cycle was replaced this time by a slower cattle inventory reduction and the cattle cycle is in fact still holding true. That being said, the national beef herd should continue to decline at a slightly faster rate for the next several years. Finally, cow-calf producers may be approaching equilibrium between production levels and the beef market or resource availability. If this is the case, extreme year to year changes in cattle inventories may be something we will not see again for some time.
Range Condition Update
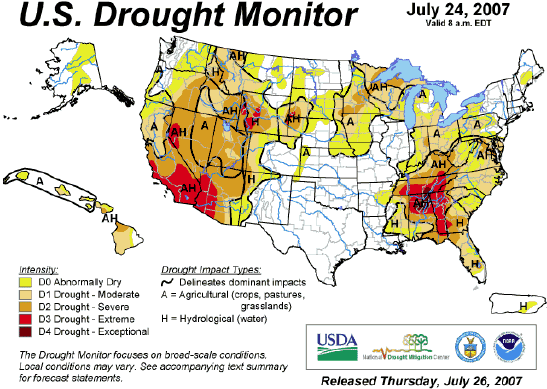
Last summer the Southern plains states were experiencing severe drought conditions. This year those states have had more than normal precipitation, leaving most of the major cattle producing areas of the country with good to excellent forage growing conditions. Table 2 contains the percentage of cattle in states according to pasture condition. Figure 2 is a from the USDA drought monitor. Although the Western states are again experiencing extremely dry conditions, there does not appear to be significant liquidation or transfer of cattle in those states.to pasture condition. Figure 2 is a from the USDA drought monitor. Although the Western states are again experiencing extremely dry conditions, there does not appear to be significant liquidation or transfer of cattle in those states.
| Beef Cows in states with 40% Poor to Very Poor | ||
| Last year | Cows | % of Total |
|---|---|---|
| 07/09/06 | 19120 | 58.12% |
| 07/16/06 | 19897 | 60.48% |
| 07/23/06 | 22809 | 69.33% |
| This Year | ||
| 07/08/07 | 7011 | 21.37% |
| 07/15/07 | 8518 | 25.97% |
| 07/22/07 | 8779 | 26.76% |
| Beef Cows in states with 40% Good to Excellent | ||
| Last year | Cows | % of Total |
|---|---|---|
| 07/09/06 | 8495 | 25.82% |
| 10 out of 10. 1 | 7064 | 21.47% |
| 07/23/06 | 5147 | 15.64% |
| This Year | ||
| 07/08/07 | 21266 | 64.83% |
| 07/15/07 | 20824 | 63.48% |
| 07/22/07 | 18680 | 56.95% |

August 2007


