


Feeding Management to Reduce the Environmental Impact of Dairy Farms
By Robert E. James, Department of Dairy Science, and Beverly Cox, Virginia Cooperative Extension. Published in the University of Florida IFAS, 45th Dairy Conference Production proceedings. Probably no region of the U.S. has experienced greater attention to impact of agriculture on our environment than Florida.Dr. Jack Van Horn, retired from the University of Florida, was an early advocate of research to demonstrate how dairy production could be good stewards of the environment through improved cropping practices and nutritional management. In recent years the Chesapeake Bay has been a focus point for environmental impact studies along the east coast. It is estimated that 95% of the phosphorus and 87% of the nitrogen entering the Chesapeake Bay arise from nonpoint sources. Agriculture accounts for 29% of the nitrogen and 49% of the phosphorus entering the bay. Concern over the impact of excessive nitrogen and phosphorus entering the Chesapeake Bay led to the signing of the 1987 Chesapeake Bay agreement with the goal of reducing N and P inflows to the CB annually by 40 % (Chesapeake Executive Council., 1987). Although progress was made toward accomplishment of this goal, the reductions were not achieved by 2000. In 2000, a new agreement was signed reaffirming the commitment to 40 % reductions in nutrient loadings to the CB with the additional goal of removing the CB from the list of impaired water bodies under the Clean Water Act by 2010 (CBP, 1999).
Consequently, agriculture is subject to environmental regulations targeted to reduce nutrient losses to water sources. A dairy farm is required by the Code of Virginia to obtain Virginia Pollution Abatement (VPA) permits if the operation has in excess of 300 animal units (DEQ, 2007). Such regulations dictate the quantity of manure and fertilizer that may be applied to each plot of land. Manure containing excess quantities of N and P must be applied at reduced rates, potentially resulting in more manure produced than can legally be applied to the land. A New York study found 61 % of N and 81 % of P imports were attributable to purchased feed (Klausner et al., 1998). Surveys have documented routine inclusion of supplemental P and overfeeding of CP in dairy rations in the mid-Atlantic and Southern United States (Bertrand et al., 1999;Dou et al., 2003;Jonker et al., 2002). Reductions in CP content and removal of supplemental P from dairy cattle rations alone have been shown to increase efficiencies of N and P utilization (Cerosaletti et al., 2004). It has been documented that long term P balance is obtainable if the use of on farm forages is optimized (Cerosaletti et al., 2004;Rotz et al., 2002;Tylutki et al., 2004). Accomplishment of net nutrient balance on the farm necessitates a precise feeding program that reduces the amount of overfeeding of CP and P and optimizes use of homegrown forages.
Achieving improved nutrient balance on dairy farms sounds easier than it is. Frequently nutritional consultants are evaluated based upon productivity of the herd. Under these conditions they are more likely to add a margin of safety to the rations by overfeeding nutrients to assure that production goals are achieved. However, several factors are combining to encourage improved nutritional management of dairy herds.
- Research has enabled the development of computer models which enable one to more accurately predict animal nutrient requirements and therefore animal performance under a given set of environmental conditions and ration nutrient contents.
- Improved tools are available to describe the nutrient characteristics of forages and concentrate ingredients.
- New varieties of forages are being developed which foster higher whole plant digestibility.
- The rapid increase in costs of supplemental energy and protein in dairy rations has provided an incentive for improved feed efficiency making overfeeding to provide a margin of safety too costly.
In summary, there has been renewed interest in “precision” feeding of dairy cattle. Actually, precision feeding is a misnomer. Effective nutritional management first involves achieving accuracy, which in the nutritional sense means the nearness of the nutrient specifications of the ration to the desired nutrient specifications as formulated by the nutritionist. Precision means achieving the same results repeatedly. Therefore it’s important that our rations are accurate first then precise.
What can we do on the dairy farm to achieve improved nutrient management and achieve improved whole farm nutrient balance through improved accuracy and precision of our rations? In 2005, the Dairy Science Department at Virginia Tech received grants from Natural Resources and Conservation Service and the Virginia Department of Conservation and Recreation to determine if precision Feeding and incentive payments could reduce nutrient losses from Virginia Dairy Farms. We are currently a little over half way into this three year study. This presentation will summarize the findings of one component of our project called the intensive feed management study.
The objectives of this study were to:
- Determine the impact of precision feeding using feed management software and monthly feed testing on whole farm nutrient balance (WFNB).
- Document current levels of accuracy and precision of feeding on Virginia dairy farms and the influence on milk production, body condition score, and income over feed cost (IOFC).
- Determine normal variation in total mixed ration (TMR) and individual feedstuffs across a 12 mo period.
- Assess producer perceptions and satisfaction with feed management software.
The impact of feed management software on whole farm nutrient balance (WFNB) and feeding management was assessed during the 2006 and 2007 calendar years. Nine treatment and 6 control farms were selected in 4 regions of the Chesapeake Bay Watershed of Virginia. Herd sizes averaged 271 and 390 lactating cows for treatment and control farms whereas milk yield averaged 30 and 27 kg/cow/d, respectively. Crop hectares grown averaged 309 and 310 hectares for treatment and control farms, respectively. Treatment farms purchased and installed feed management software (TMR Tracker, Digi-Star LLC, Fort Atkinson WI) between May and October 2006. Data was collected for calendar year 2005 and 2006 to compute WFNB using software from the University of Nebraska. On treatment farms, up to 5 feed samples were obtained monthly including each total mixed ration (TMR) fed to lactating cows. Control farms submitted TMR samples every two months. Standard wet chemistry analysis of samples was performed. Data stored in the software were collected monthly from each treatment farm concurrent with feed sampling.
The use of feed management software did not have an impact on whole farm nutrient balance. Control farms had an excess of 127 kg of nitrogen and 13 kg of phosphorus while those using feed management software retained 140 kg of nitrogen and 6 kg of phosphorus. The lack of differences in nutrient balance was attributed to the fact that some farms had been using the program for less than 4 months when balances were calculated. We are continuing with this study for two more years and have not computed balances for the 2007 year.
Milk production, crop acres grown, crops sold, and percent of homegrown forage in the ration had the greatest impact on nitrogen whole farm nutrient balance. In comparison, crops sold and percent of feed raised on the farm including forages and grains had the greatest impact on phosphorus whole farm nutrient balance.
Although we didn’t observe an improvement in whole farm nutrient balance which could be attributed to use of feed management software, we learned quite a bit about management of the feeding program on our cooperator farms. From our studies we have shown that the accuracy and precision of feeding programs has room for considerable improvement. Farms had between one and three milking herd TMR’s. Table 1and 2 demonstrate the variability observed in crude protein (CP) and phosphorus (p).


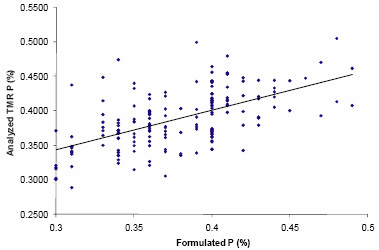
The lack of differences in CP and P between high and low groups demonstrates further challenges in obtaining both accuracy and precision in feeding programs on our cooperator herds. It should be noted that special precautions were taken to obtain a representative sample of the TMR’S fed to each milking group. This included obtaining multiple samples during unloading, followed by thorough mixing of the sample prior to sending it to the forage testing lab. Figures 1 and 2 demonstrate deviation of expected vs. analyzed values for both crude protein and phosphorus.
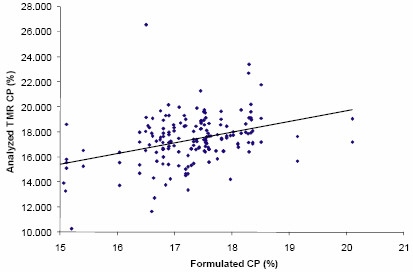
Similar results were observed for formulated versus analyzed P in TMR’s as shown in Figure 2.
Errors in accuracy and precision can be attributed to variability in feedstuffs and / or operator error. Frequent sampling of forages and commodities revealed considerable variability in both CP and P content as shown in Figures 3 and 4.
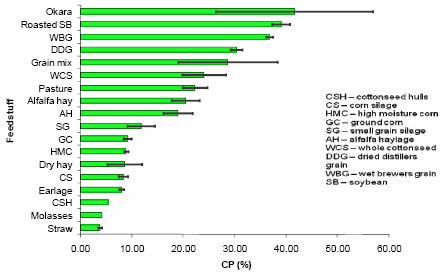
Figure 4. Feedstuff phosphorus variability.
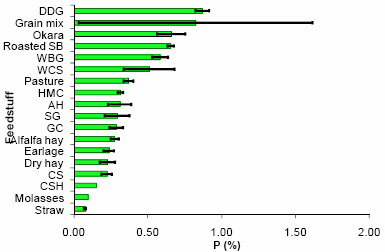
It was expected that variation would be high in grain mixtures as they differed considerably from farm to farm depending on the feeding program. The feedstuff with the greatest variability was Okara, a byproduct from the production of soy milk beverage. Forages and byproducts were also characterized by larger variation in nutrient content. Failure to test these feeds routinely is a potential reason for deviation between expected and analyzed values for nutrients in the TMR’s.
Operator error was evaluated by comparing loading and delivery accuracy information obtained from the TMR Tracker software. Mean load deviation was compared feeder and day of the week. No differences could be attributed to day of the week. However, we did observe differences between primary, secondary and sporadic feeders. The primary feeder was responsible for mixing and delivery of the TMR more than 75% of the time. It was expected that the mean load deviations from formulated TMR’s would be lower for the primary feeder. However, this was not the case as in most cases the secondary feeder had superior performance. Possibly, the primary feeder developed undesirable habits.
We also noted that certain feeds were more likely associated with certain feeding loading deviations. These relationships are shown in Figure 5.
Average Ingredient Deviation
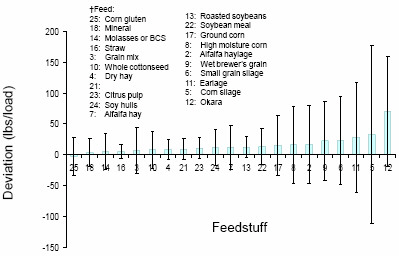
It’s important to view not only the average deviations, but also the range in deviations in pounds per load. Greatest deviations were observed for okara, corn silage and earlage. Loading errors can be attributed to the physical characteristics of the feed or possibly its storage location in relation to the position of the mixer wagon. To clarify the latter point, if corn silage is loaded with a bucket loader and the silo is some distance from the mixer wagon, it is tempting for the operator to accept over or under loading to save time.
Significant differences were observed between farms in loading accuracy. This can be attributed to differences in operator ability and diligence, equipment and the physical layout of feed storage facilities. Figure 6 illustrates the average and range in loading errors observed in our cooperator herds.
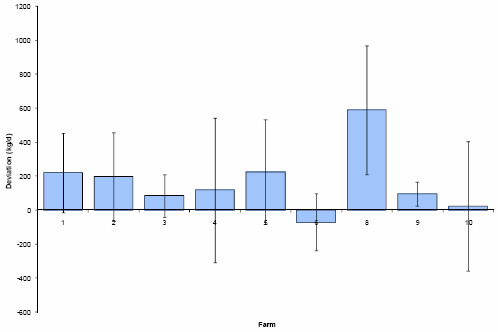
Accuracy and precision are achieved with the smallest average deviation from the formulated ration and the smallest variation. It might be assumed that herd 10 excelled. However on the average this herd was accurate, but not very precise in that daily variations were quite large. Feeding management excelled in herds 9 and 3 in which the feeding programs were relatively simple and mixing was performed by one person with owner filling in when needed. The greatest problems were observed in herd 8 in which the owner did over 90% of the feeding and assumed that feeding was accuracy without consulting feed management reports. In herd six, all feeds produced on the farm, including high moisture corn and all silages, were stored in concrete stave or bottom unloading silos. Controls for the various silos were located at different ends of the feed room. The indicator was not always visible during loading, necessitating turning unloaders off based solely on alarms signifying a tolerable range was achieved. Accuracy consequently shifted considerably from day to day, leading to more underfeeding than other farms experienced. Another factor in the large amount of underfeeding was the unreliability of bottom unloaders in the bottom unloading silos.
These unloaders frequently broke midway through a load, requiring advancement to the next ingredient before loading of the previous ingredient finished. Equipment location and failure were the driving forces behind underfeeding on this operation.
To assess the effect of feeding accuracy on milk production, daily milk shipments were compared via regression to the daily feeding deviation, or error. Daily deviation in total kg fed was negatively associated with milk production, indicating an increase in milk production as feeding accuracy increased. This agrees with the findings of Tylutki et al. (2004) that daily milk variation increased from 0.5 to 2.0 kg/d per cow during periods of inadequate feeding management. Similarly, there was an increase in milk production as accuracy of CP feeding increased. Again, these results highlight the ineffectiveness of overfeeding in increasing milk production and correspond to the 13% increase in production from a 2% decrease in CP documented by Klausner et al. (1998).
Conversely, increasing kg of P fed demonstrated a positive association between milk production and daily percent deviation in P fed. However, while this relationship is significant, this association may be due not to the increased level of P in the diet, but changes in the diet that promote higher production associated with higher P levels. A moderate correlation (r = 0.27) was found between ration NEL and P, indicating increases in NEL concurrent with P increases. It is believed that the association between increased milk production and P content is due to the related increase in energy density of the ration from larger amounts of these high P content feeds.
Loading accuracy suffered as DM content of feedstuffs decreased. Difficulty of handling feeds with more moisture led to more imprecise loading, perhaps associated with the perception low DM feeds are less expensive. Feeding deviation did not differ by feeder or day of the week. Consequently, all employees should be evaluated equally to impact change in feeding deviation.
Process control analysis demonstrated that 4 % of all loads were underfed more than 2 standard deviations, while frequency of overfeeding in excess of 2 standard deviations was 33 %. Implementation of six sigma (Eckes, 2000;Pande, 2002) should begin by reducing this deviation initially to within 1 standard deviation (92kg/load). Utilizing 2006 feeding data as baseline, farms should be evaluated for areas of improvement. Strategies for each individual farm are needed to target specific weaknesses of each operation. Future research efforts should document the adoption and success of six sigma approach to improving feeding management.
All producers surveyed after the first year reported that the software met expectations and if given the choice would invest again. Despite satisfaction, 4 of 9 were uncertain or would not purchase the software without the subsidy provided by the project. All but one perceived feed management software as economically beneficial. All farms reported utilizing the software to monitor operator performance and saw no change in quantity of feed purchased during the first year. Five producers noted improvements in ration consistency following TMR Tracker use. A significant positive correlation (r=0.80) was revealed between changes made to the feeding program due to TMR Tracker and improvements in ration consistency. Of those surveyed, more than half (5 of 9) state training employees as the most challenging aspect of implementing TMR Tracker. A strong negative correlation (r=-0.77) was found between the frequency reports are viewed and the greatest challenge faced from the program. These results indicate that the obstacle to viewing reports was dedicating adequate time to the program. Forty-four percent of respondents attributed most problems encountered to operator error. After two years all cooperators continue to use the feed management software and have discovered additional tools which have proved beneficial including inventory management and more accurate estimation of feed costs and income over feed cost.
Take home message
- We don’t do a very good job of managing our evaluating our feeding program.
- Milk production decreased with greater variation and increased protein overfeeding.
- Feed management software provides tools to evaluate:
- Shrink
- Personnel
- Procedures
- Facilities
- Feed management software provides the tools to enable better control of whole farm nutrient balance if used properly.
References
Bertrand, J. A., J. C. Fleck, and J. C. McConnell, Jr. 1999. Phosphorus intake and excretion on South Carolina dairy farms. Prof. Anim. Sci. 15(4):264-267.
Cerosaletti, P. E., D. G. Fox, and L. E. Chase. 2004. Phosphorus reduction through precision feeding of dairy cattle. J. Dairy Sci. 87:2314-2323
Chesapeake Executive Council. 1987. 1987 Chesapeake Bay agreement: Final draft. Chesapeake Executive Council, S.l.
Cox, B. G. 2007. Impact of Precision Feeding Strategies on Whole Farm Nutrient Balance and Feeding Management. M.S. Thesis. Virginia Polytechnic Institute and State University. Blacksburg.
DEQ. 2007. Subject: Confined animal feeding operations. http://www.deq.state.va.us/vpa/cafo.html. Accessed February 26, 2007.
Dou, Z., J. Ferguson, D., J. Fiorini, and J. Toth, D. 2003. Phosphorus feeding levels and critical control points on dairy. J. Dairy Sci. 86:3787-3795.
Eckes, G. 2000. The six sigma revolution: How general electric and others turned process into profits. John Wiley & Sons, Inc., New York, NY.
Jonker, J., S., R. Kohn, A., and J. High. 2002. Dairy herd management practices that impact nitrogen utilization. J. Dairy Sci. 85:1218-1226.
Klausner, S. D., D. G. Fox, C. N. Rasmussen, R. E. Pitt, T. P. Tylutki, P. E. Wright, L. E. Chase, and W. C. Stone. 1998. Improving dairy farm sustainability. I. An approach to animal and crop nutrient management planning. Production agriculture 11:225-233
Pande, P. a. L. H. 2002. What is six sigma? McGraw-Hill, New York, NY.
Rotz, C., A., A. Sharpley, N., L. Satter, D., and W. Gburek, J. 2002. Production and feeding strategies for phosphorus management on dairy farms. J. Dairy Sci. 85:3142- 3153.
Tylutki, T., P., D. Fox, G., and M. McMahon. 2004. Implementation of nutrient management planning on a dairy farm. Prof. Anim. Sci. 20:58-65.
Further Reading
| - | You can view a full list of the 45th Dairy Conference Production proceedings by clicking here. |
April 2008


