


Financial Performance of Australia's Dairy Farms
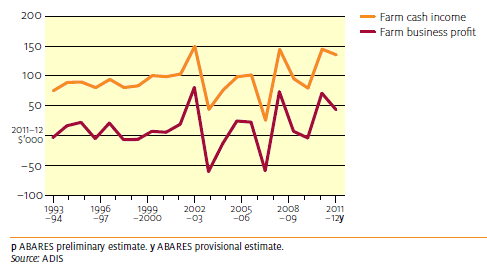
The national average farm cash income of dairy industry farms increased from $75 110 in 2009–10 to $141 000 in 2010–11, the highest since 2007–08, according to a report from the Australian Bureau of Agricultural and Resource Economics and Sciences.
Introduction
This report draws heavily on information obtained from dairy producing farms
included in the ABARES annual Australian dairy industry survey (ADIS), which is
part funded by Dairy Australia. It expands on farm survey results that were
published in Agricultural commodities March quarter 2012 released at the ABARES
Outlook 2012 conference.
The ADIS was conducted between July and November 2011, covering 2010–11 and
making projections for 2011–12. Results are reported at national and regional levels,
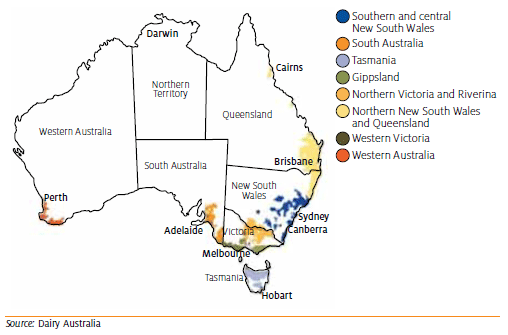
covering northern New South Wales and Queensland, northern Victoria and Riverina
(NSW), Tasmania, Western Australia, South Australia, the Gippsland region (Vic.),
western Victoria, and southern and central New South Wales (Map 1).
Dairy Australia commissioned ABARES to summarise the key results of ADIS into
statistical tables and figures, as set out in this report.
Dairy Farming Regions
Dairy industry financial performance
2010–11
The national average farm cash income of dairy industry farms increased from
$75 110 in 2009–10 to $141 000 in 2010–11, the highest since 2007–08 (Figure 1).
The increase in average farm cash income was mainly due to higher prices paid for
milk in regions producing manufacturing milk. Milk production remained similar to
that in 2009–10, despite improvement in grazing conditions and increased
availability of irrigation water (Table 1).
The improved seasonal conditions resulted in an increase in on-farm fodder
production, which helped reduce fodder costs for dairy farms by 8 per cent in
2010–11 (Table 1). However, other farm costs, such as interest payments, increased in
2010–11 and as a result average dairy farm costs remained relatively unchanged
from 2009–10 (Table 1).
Farm Cash Income and Farm Business Profit
Average Per Farm
2011–12
In 2011–12, the average farm cash income for dairy farms is projected to decline slightly from $141 000 in 2010–11 to $136 000 per farm (Table 1). This decline is mainly due to lower milk prices. A small increase in milk production is expected in 2011–12 as a result of further improvement in seasonal conditions, increased availability of irrigation water and lower fodder prices in 2011–12 (Table 1).
Financial performance and outlook by region
2010–11
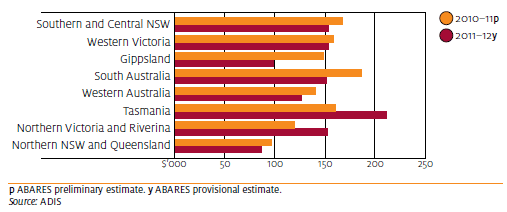
Farm cash income for dairy farms in much of Victoria, Tasmania, South Australia and the southern dairying regions of New South Wales increased in 2010–11. The increase was a result of higher prices paid for milk in regions producing mainly manufacturing milk, and a small increase in milk production. Average farm cash income in Gippsland and western Victoria rose to $148 000 and $157 900 per farm respectively in 2010–11. Over the same period in Tasmania, farm cash income increased to $159 900 per farm (Table 2). In contrast, average dairy farm cash income declined in other parts of New South Wales and Western Australia, as a result of a decline in average milk prices.
2011–12
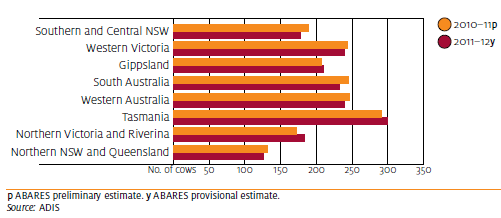
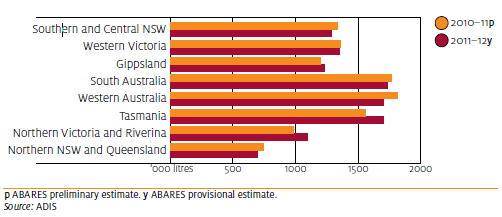
In 2011–12, average dairy farm cash income is projected to increase in Tasmania,
northern Victoria and Riverina in response to increased milk production (Figures 2,
3 and 4).
In Tasmania, a relatively large increase in milk production is expected to boost
average milk receipts and, despite increases in cash costs, result in farm cash income
in that state rising to average $211 000 per farm (Figures 2 and 4).
Milk receipts for other dairy regions are expected to decline. In northern New South
Wales, Queensland, Western Australia and South Australia, lower milk prices
combined with reduced milk production is projected to result in lower farm cash
incomes, despite some reduction in total cash costs as a consequence of reduced
expenditure on fodder. Farm cash income is projected to average $126 000 per farm
in Western Australia and $152 000 in South Australia. In Gippsland, lower milk prices
combined with increased expenditure on fertiliser and repairs is projected to result
in farm cash income declining to $99 000 per farm in 2011–12 (Table 2).
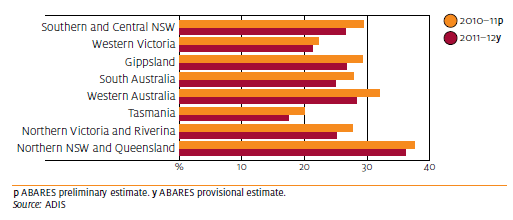
The improved seasonal conditions are expected to result in a reduction in fodder
expenditure and lower total cash costs in 2011–12 for all regions except Tasmania
and Gippsland. The proportion of total cash costs accounted for fodder is expected to
decline (Figure 5); however, fertiliser costs are expected to increase in all regions as
dairy farms produce more feed on-farm (Table 4).
Farm Cash Income, by Region
Average Per Farm
Maximum Cows Milked for More than 3 Months, by Region
Average Per Farm
Milk Production, by Region
Average Per Farm
Ratio of Fodder Costs to Total Cash Costs, by Region
Average Per Farm
Capital investment, farm equity and debt servicing
2010–11 appears to have been a period of consolidation for dairy farmers with higher
incomes and a smaller level of investment in capital additions leading to some
lowering of debt. This trend is likely to have continued into 2011–12. The recent
decline in average land values may have also contributed to the desire and need to
reduce debt levels.
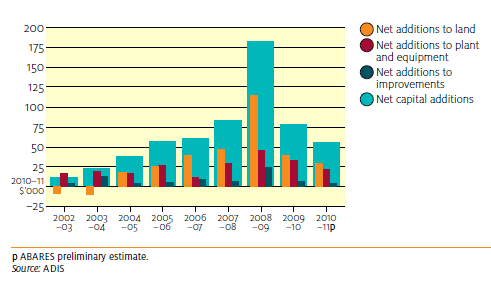
In 2010–11, net capital additions of dairy farms declined from $78 000 to average
$56 000 per farm (Figure 6). The proportion of dairy farms acquiring additional land
declined in 2010–11 compared with 2009–10 (Figure 7).
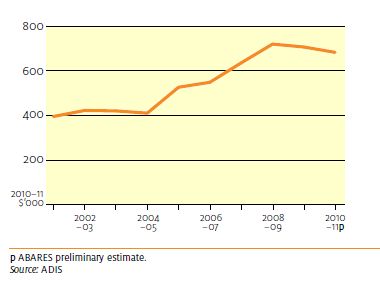
Average debt per farm in the dairy industry declined in 2009–10 and is estimated
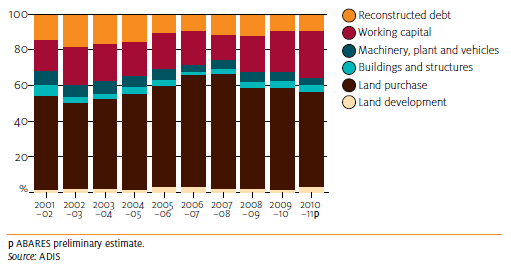
to do so in 2010–11 (Figure 8). Debt for land purchase continues to account for
the largest share of dairy farm debt, with borrowings to provide working capital
accounting for the next largest share of average farm business debt (Figure 9).
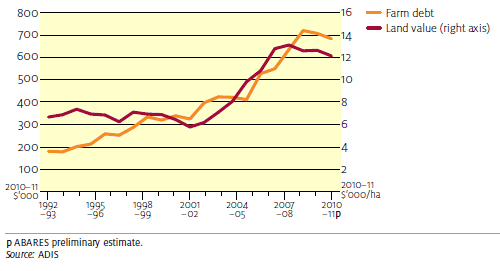
Average farm equity has remained strong despite a large proportion of debt being
used to fund land purchase and working capital, because the rise in debt over
the previous years was mostly offset by increases in land values since 2001–02
(Figure 10). The average equity ratio for dairy farms at 30 June 2011 was 81 per cent
(Table 1). The proportion of dairy farms estimated to have a farm business equity ratio of greater than 70 per cent was 75 per cent in both 2009–10 and 2010–11
(Table 3). Significantly, the proportion of farms with equity ratios below 70 per cent
and with negative farm cash income halved from 14 per cent in 2009–10 to 7 per cent
in 2010–11. Often, farms with negative farm cash income need to increase borrowing
to meet the shortfall in cash flow.
Net Capital Additions
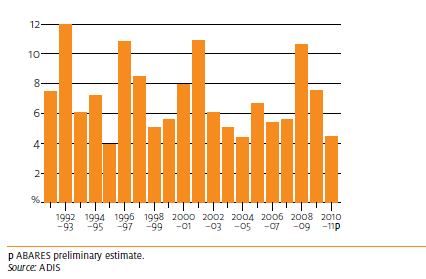
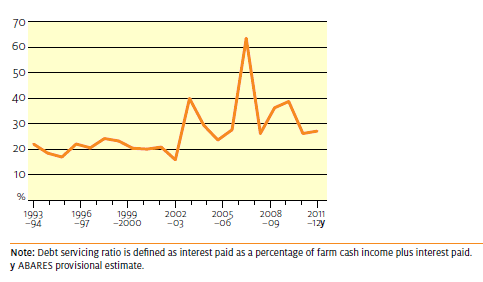
Increase in average farm debt resulted in the proportion of farm cash income needed to meet interest payments (debt servicing ratio) trending upward between 2002–03 and 2009–10 (Figure 11). In 2010–11, the debt servicing ratio declined as farm cash incomes rose; the ratio is expected to be similar in 2011–12 due to slightly lower interest rates, but still above the debt servicing ratios experienced during the 1990s.
Proportion of Dairy Farms Acquiring Land
Dairy Farm Debt
Average Per Farm
Composition of Dairy Farm Debt
Average Per Farm
Farm Debt and Land Values
Average Per Farm
Debt Servicing Ratio
June 2012
| TheCattleSite News Desk |


