Florida Dairy Industry Statistics: Herd Performance Measures and Benchmarks
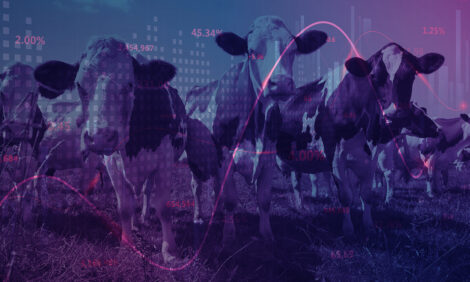
Wide ranging aspects of Florida dairy herds are analysed in this paper from University of Florida including lactation peak and milk quality. The huge swings in herd numbers across the state show quick recovery from the 90's decline by K.G. Arriola and A. De Vries. 30 April 2013
 5 minute read
This publication summarizes technical performance data of dairy herds in Florida and the Southeast United States collected through the Dairy Herd Improvement (DHI) program. These benchmark data are intended for dairy producers, the allied dairy industry, dairy Extension personnel, and dairy students. Benchmarking is a process that a dairy farm can use to evaluate and compare itself in chosen areas to an external reference point to monitor and improve its practices. Benchmark data are also useful in teaching.
Tables 1 and 2 show technical data collected in Florida herds from 1993 to 2012 from a variety of published sources. The number of dairy cows enrolled in the Florida DHI program decreased from 55,648 head in 1993 to 45,954 head in 2012 after a low of 30,879 head in 2002. This number (45,954 head) is approximately 40% of the dairy cows in Florida in 2012. Notable changes from 1993 to 2012 are the increase in herd size, increase in milk production per cow, variation in days open, and the decrease in percent left herd.
For more information on the definition and calculation of the various technical dairy measures used in the tables in this publication, see the DHI Glossary (October 2011) from Dairy Records Management Systems in Raleigh, NC, the processor of the DHI records (available at http://www.drms.org/PDF/materials/glossary.pdf).
The 2012 results for herds in Florida and the Southeast have been sorted by herd size (Table 3), milk production (Table 4), somatic cell count (Table 5), pregnancy rate (Table 6), and percent of herd bred to proven AI (artificial insemination) sires (Table 7). The data were sorted to have a similar number of Florida herds in each of the three categories. Then those categories were also used for the results in the Southeast region, although the number of Southeast herds in each category may not be similar.
Table 3 shows the data sorted by herd size. On average, larger herds produced more milk per cow, had better milk quality, and had better reproduction. Table 4 shows the data sorted by rolling milk, which is the total milk produced in the last 365 days. Herds that produced more milk per cow were on average larger, had better milk quality, had better reproduction, and used genetically superior sires. Table 5 shows data sorted by somatic cell counts, expressed in thousands of cells per ml. Somatic cell count is a measure of milk quality. Herds with better milk quality were on average larger and produced more milk per cow. Table 6 shows data sorted by pregnancy rate. Herds with greater pregnancy rates were on average larger, produced more milk per cow, and had better milk quality. Finally, Table 7 shows data sorted by herd bred to proven AI bulls (%). Herds with a greater percentage of their animals bred to proven AI bulls were on average larger and produced more milk per cow per year. Reproduction was better, too.
A national, uniform set of technical performance measures for dairy herds does not exist. Therefore, these benchmark statistics may be compared to similar data found at various websites, including the USDA (http://www.aphis.usda.gov/animal_health/nahms/dairy/index.shtml; http://aipl.arsusda.gov) and the University of Wisconsin (http://future.aae.wisc.edu).
Table 1. Florida Dairy Herd Performance Averages from 1993 to 2001.1


Note: For a further explanation of measures used in this table, visit http://www.drms.org/PDF/materials/glossary.pdf.
Table 2. Florida Dairy Herd Performance Averages from 2002 to 2012.


2Source: Southeast DHIA, Cows in Herds on official types of test (01–34).
3Source: Southeast DHIA, Cows in Herds on all types of test (01–74).
1,2,3 Source: Appendix, Florida Dairy Production Conference, accessed December 21, 2012, http://dairy.ifas.ufl.edu.
4 Source: Dairy Records Management Systems, accessed December 21, 2012, http://www.drms.org.
*NA = not available
Note: For a further explanation of measures used in this table, visit http://www.drms.org/PDF/materials/glossary.pdf.
Table 3. Florida and Southeast DHIA Dairy Herd Performance Averages Sorted by “Number of Cows-All Lactations” (2012).1


2 DHIA herds in Alabama, Florida, Georgia, Louisiana, Mississippi, South Carolina, and Tennessee.
Note: For a further explanation of measures used in this table, visit http://www.drms.org/PDF/materials/glossary.pdf.
Table 4. Florida and Southeast DHIA Dairy Herd Performance Averages Sorted by “Rolling Milk (lbs/cow/year)” (2012).1


2 DHIA herds in Alabama, Florida, Georgia, Louisiana, Mississippi, South Carolina, and Tennessee.
Note: For a further explanation of measures used in this table, visit http://www.drms.org/PDF/materials/glossary.pdf.
Table 5. Florida and Southeast DHIA Dairy Herd Performance Averages Sorted by “SCC Actual (x1000)” (2012).1


2 DHIA herds in Alabama, Florida, Georgia, Louisiana, Mississippi, South Carolina, and Tennessee.
Note: For a further explanation of measures used in this table, visit http://www.drms.org/PDF/materials/glossary.pdf.
Table 6. Florida and Southeast DHIA Dairy Herd Performance Averages Sorted by “Pregnancy Rate Year Average (%)” (2012).1


2 DHIA herds in Alabama, Florida, Georgia, Louisiana, Mississippi, South Carolina, and Tennessee.
Note: For a further explanation of measures used in this table, visit http://www.drms.org/PDF/materials/glossary.pdf.
Table 7. Florida and Southeast DHIA Dairy Herd Performance Averages Sorted by “Herd Bred to proven AI Bulls (%)” (2012).1


2 DHIA herds in Alabama, Florida, Georgia, Louisiana, Mississippi, South Carolina, and Tennessee.
Note: For a further explanation of measures used in this table, visit http://www.drms.org/PDF/materials/glossary.pdf.
Footnotes
- This document is AN286, one of a series of the Department of Animal Sciences, Florida Cooperative Extension Service, Institute of Food and Agricultural Sciences, University of Florida. Original publication date February 2013. Visit the EDIS website at http://edis.ifas.ufl.edu.
- K.G. Arriola, post-doctoral research associate, Department of Animal Sciences; and A. De Vries, associate professor, Department of Animal Sciences; Florida Cooperative Extension Service, Institute of Food and Agricultural Sciences, University of Florida, Gainesville, FL 32611.
Further ReadingYou can view the full report by clicking here. |
April 2013