

International dairy prices
Tight global supplies amid sustained demand drove international dairy prices steeply in 2021Editor's note: The following is an excerpt from FAO's Dairy Market Review: Overview of market policy developments 2021.

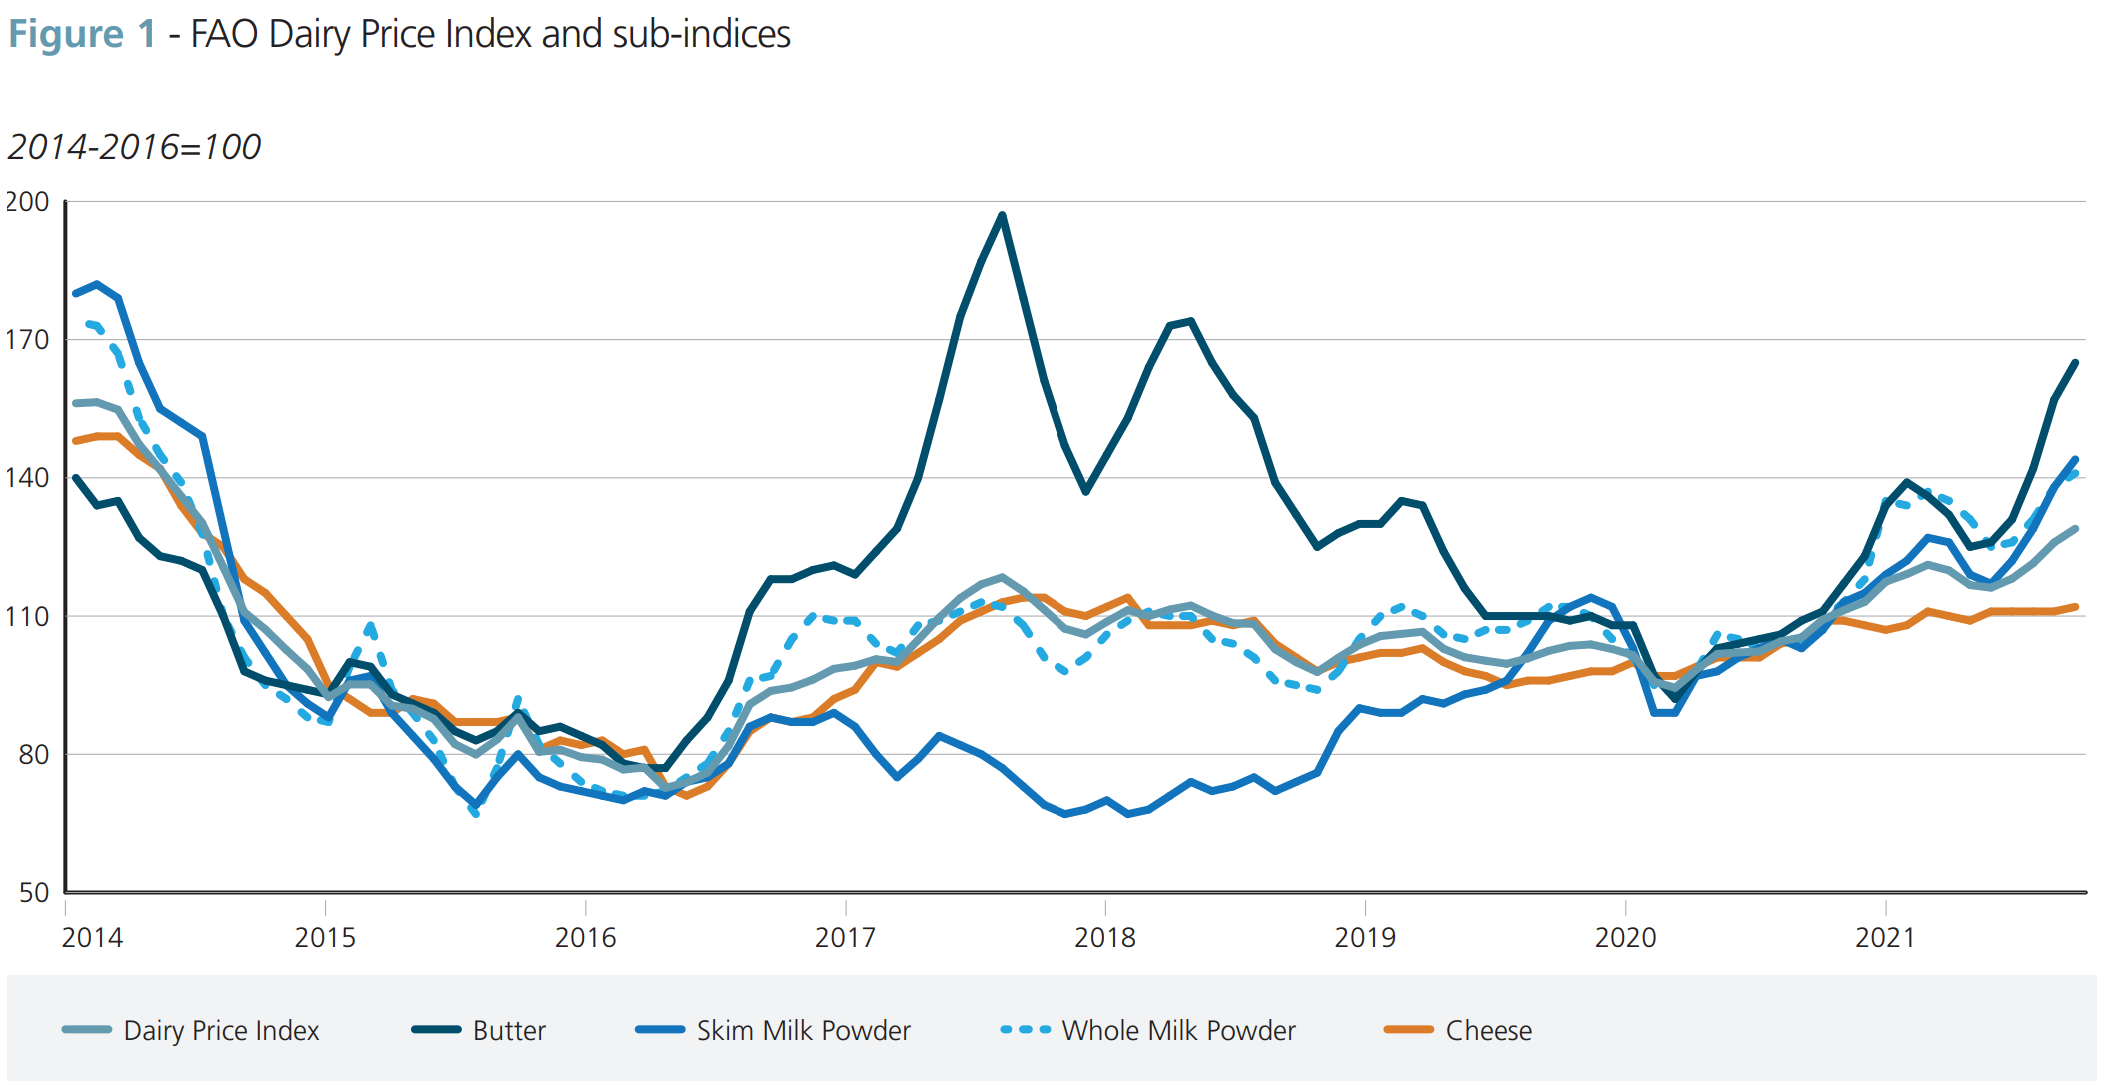
International dairy prices measured by the FAO Dairy Price Index, averaged 119 points in 2021, up 17.3 points (17.0 percent) from 2020, with steep increases in butter (+29.9 percent), whole milk powder (WMP) (+26.8 percent) and skim milk powder (SMP) (+22 percent) sub-indices and a moderate increase in cheese sub-index (+8.8 percent).
Tight supplies from the leading dairy exporting countries amidst sustained global import demand underpinned the dairy price increase in 2021. In Western Europe, milk deliveries in 2021 were lower due to the declining dairy cattle numbers. Besides, colder than expected start to the year for several months in Northern Europe and rising input costs, mainly feed, led to lower producer margins, inducing more cattle slaughter and weighing on milk deliveries. New Zealand started the year with drier conditions, negatively affecting pasture quality in parts of the country.
Contrary to expectations, milk output in the 2021/22 season tracked below the previous season due to excessive rains and wet conditions. Reflecting these unfavourable conditions, milk production in Europe and Oceania fell by 0.4 percent and 0.2 percent, respectively. Aggregate milk output of seven of the largest milk exporters the European Union, New Zealand, the United States of America [the United States], Belarus, Australia, the United Kingdom of Great Britain and Northern Ireland [the United Kingdom] and Argentina) registered only 0.4 percent growth rate in 2021. The slow growth of production in the leading exporting dairy countries, coupled with the rebound in internal demand, led to the tightening of global export availabilities.
On the demand side, global dairy imports remained solid, driven by a sharp increase in purchases by China (+22.2 percent) due to increased demand from consumers and whey powder as feed for piglets by the pig meat industry. Import demand was strong across milk powders, cheese, butter and whey, exerting significant upward pressure on dairy prices. In addition, economic recoveries and resumption of food services activities also supported international dairy imports, adding to already tight global markets.
Global milk production
World milk output continued to expand in 2021, albeit at a slower pace
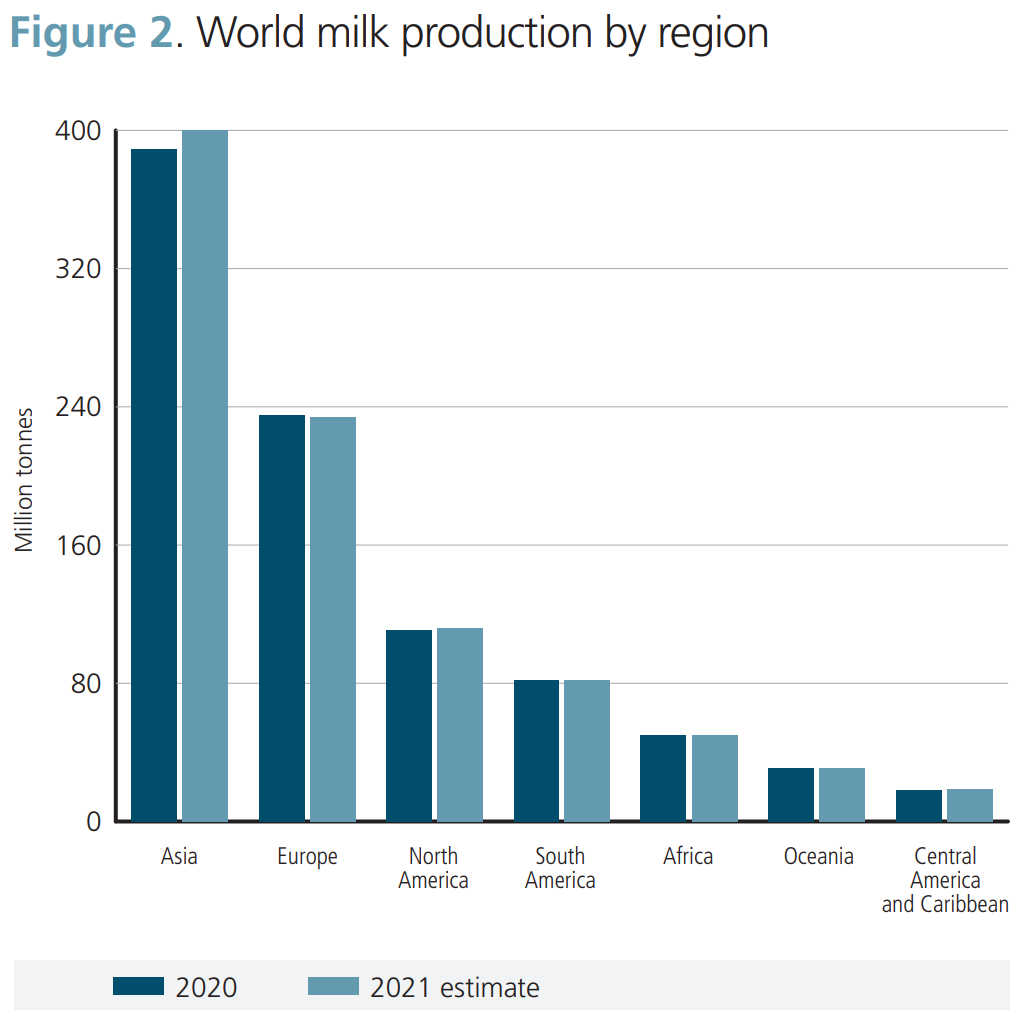
Global milk production reached nearly 928 million tonnes in 2021, up 1.3 percent from 2020, driven by output increases in all geographical regions except Europe and Oceania, where production decreased. Milk volume increases were highest in Asia, followed by the Americas. The production growth rate in 2021 was the lowest registered since 2013.

In Asia, milk output rose to 400 million tonnes in 2021, up 2.9 percent year-on-year, principally driven by increases in India, China, Pakistan, Uzbekistan, Kazakhstan and Japan. In India, milk output reached 210 million tonnes in 2021, up 3.0 percent from
2020, underpinned by good monsoon rains (June to September) that increased feed and fodder availability and raised dairy cattle herd numbers.
India’s efforts to improve the low genetic potential of dairy cattle, increase fodder availability and expand milk collection continued under various development programs, including the National Livestock Mission and Feed Development. In China, increased investment in large-scale farms, higher quality genetics and vertically integrated production systems, which led to an increase in dairy cattle and productivity, underpinned a 7 percent expansion in milk output in 2021.
In Pakistan, increased cattle numbers lifted milk production by 3.2 percent. The continued modernization of farms facilitated milk production expansions in Kazakhstan and Uzbekistan. In Japan, government subsidies and dairy herd expansion led to a 2.1 percent increase in output in 2021.
In Europe, milk output reached 234 million tonnes, a slight drop (-0.4 percent) from 2020, mainly due to production decreases in Ukraine and the European Union. In Ukraine, output continued to weaken, reflecting the unrelenting decline in the cattle herd and high input costs that limited farm profitability. In the European Union, increased production costs influenced cattle slaughter and hastened the decline in dairy cattle numbers, which led milk deliveries to drop by 0.3 percent for the first time since 2009.
On the positive side, milk price increases and the COVID-19 livestock assistance programme helped farmers but were inadequate to stem the decline in cattle numbers. By contrast, in the Russian Federation, milk production surged due to productivity improvements, as modern farms invested in highly productive dairy breeds and advanced equipment. Increasing yield and farm management improvements in Belarus led to higher milk production.
In North America, milk output reached nearly 112 million tonnes in 2021, up 1.4 percent from 2020. In the United States, milk output rose by 1.3 percent, reaching 103 million tonnes, driven by high dairy cow numbers until mid-2021 and increased milk productivity. However, herd levels began to fall in July due to increased slaughter induced by squeezed profit margins. In Canada, milk output increased by 1.7 percent, reflecting a rebound in dairy cattle numbers to a 15-year high due to increased farmgate milk prices.
In Central America and the Caribbean, milk production expanded by 1.5 percent in 2021, reaching 19 million tonnes. Despite unprecedented COVID-19 challenges and increasing feed costs, Mexico’s 2021 production grew by 2.5 percent due to improvements in farming technology and genetic enhancements. Meanwhile, domestic consumption has stabilized following the pandemic-related drop in 2020.
In South America, milk production remained stable, reaching nearly 82 million tonnes in 2021, driven by higher outputs in Argentina, Colombia, and Uruguay, offset by declines in Brazil. In Argentina, milk production expanded due to good weather, investments in modern farming and increased dairy herd numbers. Brazil’s milk output dropped by 2.2 percent due to poor pasture conditions and rising input costs. Reduced dairy herd numbers also weighed on milk output, as increased cattle prices and high feed costs influenced farmers to sell their cattle in 2020.
In Oceania, following a 1.1 percent expansion in 2020, milk output decreased marginally (0.2 percent) in 2021, reaching 31 million tonnes. In Australia, extremely wet conditions in the second half of the year, increased input costs of fertilizer and energy, combined with the skilled labour shortage, led to a decline in milk production by 0.8 percent in 2021. In New Zealand, milk output increased by a meagre 0.1 percent in 2021, principally due to cold and wet spring conditions that prevailed towards the end of 2020 and several supply-side constraints, including increased input costs, labour shortages and relatively tight producer margins.
In Africa, milk output remained virtually unchanged at about 50 million tonnes. Moderate output expansions in many countries offset drops in larger producing countries. In Kenya, poor rainfall and rangeland conditions negatively affected pastoral grazing lands in northern, central and southern agropastoral areas, lowering milk output by 1.0 percent. In South Africa, milk production decreased due to drought and higher feed and input costs, making profit margins tight for farmers. In many countries with significant cattle stocks and milk production, poor weather conditions and conflicts disrupted dairy supply chains, limiting milk output.
International dairy trade
Global export trade expanded moderately in 2021, reflecting tight supplies and high prices
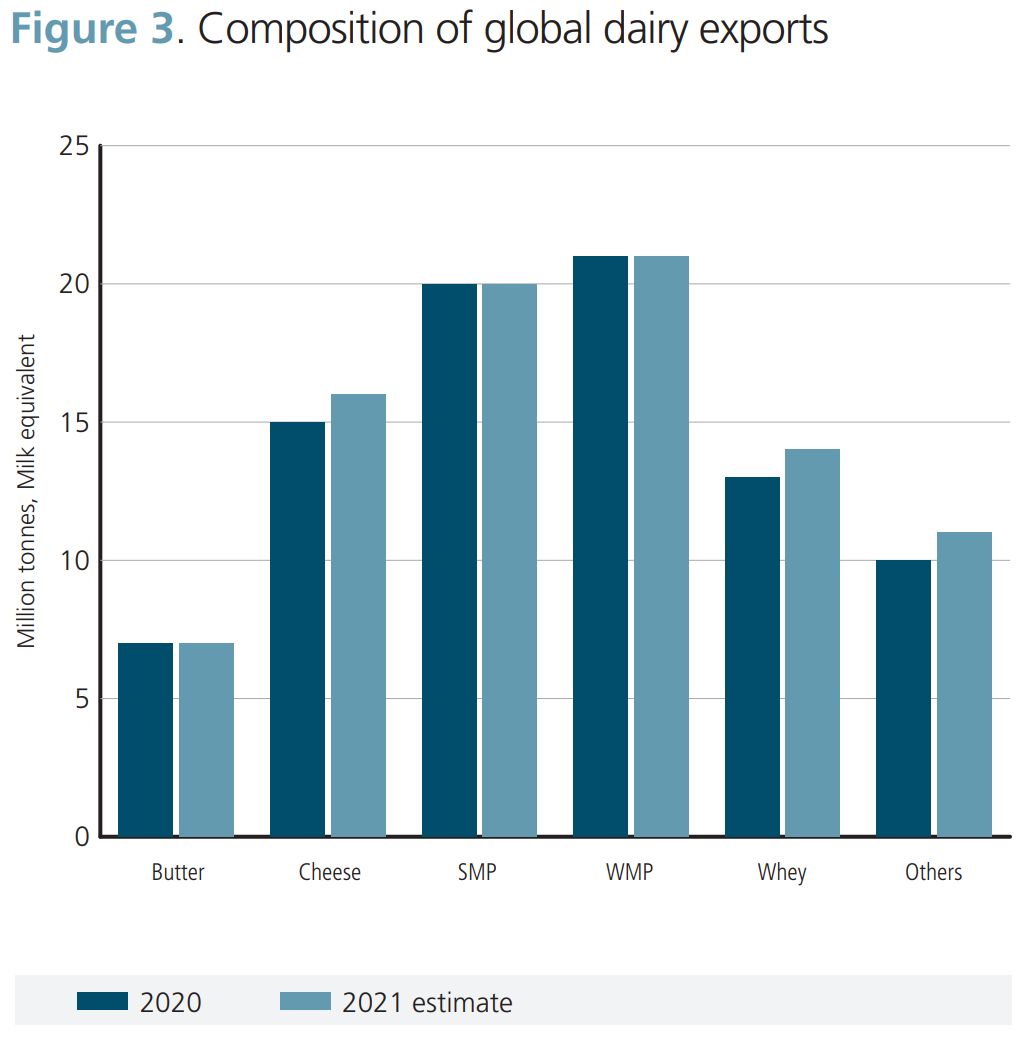
International dairy trade increased by 1.8 percent to nearly 88 million tonnes (milk equivalent) in 2021, primarily driven by a sharp rise in imports by China, along with moderate volume gains by Mexico, Indonesia, Viet Nam and the Republic of Korea, among others. Asia registered the largest increase in dairy imports in 2021, followed by Central America and the Caribbean and North America. By contrast, Europe, Africa, South America and Oceania registered import declines.
Imports by China increased by a record high growth rate of 22.2 percent in 2021, to 20.7 million tonnes, with WMP and whey powder purchases constituting the bulk of imports, driven by increased demand from consumers and the pig meat industry. In Mexico, in 2021, the rebound in the hospitality industry led dairy imports to expand, mostly dry skim milk and cheese products. In the Republic of Korea, dairy product imports rose, driven by the continued high demand for butter, cheese and cream, partly induced by the tariff rate quota increases under trade agreements.
By contrast, purchases dropped substantially in the European Union, the United Kingdom, Saudi Arabia, Brazil, Japan and the Russian Federation, among many others. The decline in imports by the European Union and the United Kingdom mainly reflected the impact of trade disruptions due to administrative procedures and the health certificate requirement following Brexit.
A sharp curb in milk powder purchases in 2021 led to a decrease in milk product imports in Saudi Arabia, mainly balancing internal availabilities, including stocks, with consumer demand. Similarly, Brazil’s WMP imports fell back from an all-time high in imports in 2020. Increased dairy product prices also weighed on consumer demand amidst lower purchasing power and sluggish labour market conditions. In Japan, high domestic availability, especially SMP, driven by a spike in domestic production, caused imports to be one of the lowest seen in recent times. Concerning exports, the United States, New Zealand, Australia and Türkiye supplied much of the increased global demand, whereas the United Kingdom, the European Union, Saudi Arabia, Canada and Egypt, among others, saw their exports decline.

Reference
FAO. 2022. Dairy Market Review: Overview of global dairy market and policy developments in 2021. Rome.


